HUGLO: Hyper-Ultra-Giga Low-Overhead Tracing Profiler for Ruby
I’ve built what I think is a pretty neat Ruby tracing profiler. It captures four event streams: Ruby function calls, system calls, thread-state changes, and garbage-collection activity, while adding less than 30 ns of overhead per Ruby function call, low enough for continuous use in large-scale production systems.
As far as I know, no other Ruby tracer offers this mix of signals at this cost. If you’re aware of one, please let me know and I’ll add a note here (and remove a couple of adjectives from the title).
I haven’t open-sourced the code yet because it is very much in a proof-of-concept state and I’m busy with other projects. If you think it would be valuable to you, let me know. If I see enough interest I’ll move it up my priority list.
Overhead Measurement
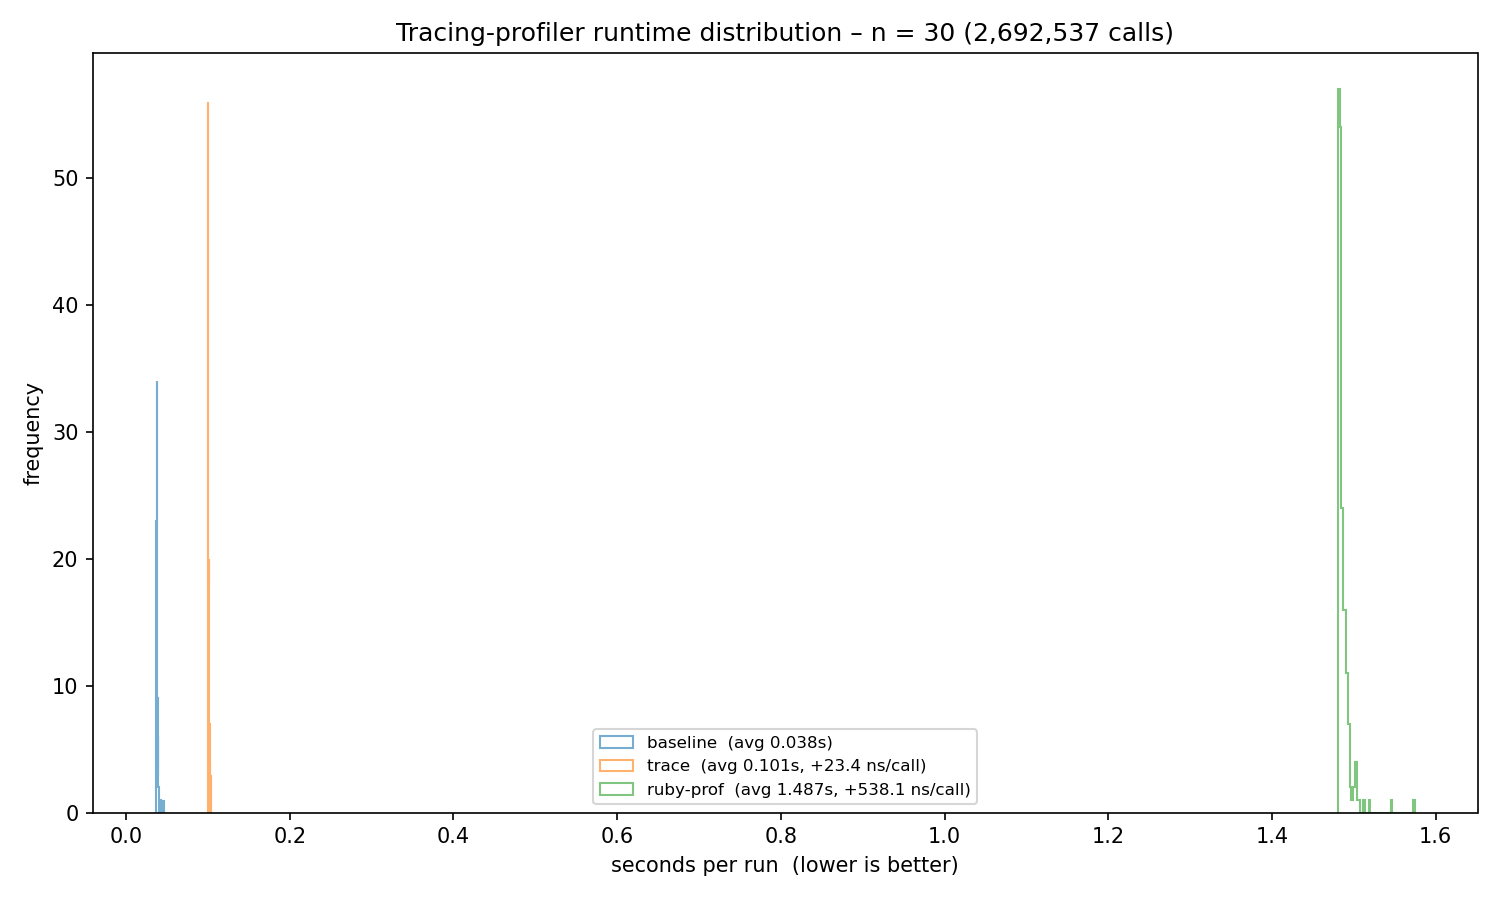
Above is a runtime histogram of 200 runs of a sample workload on an i5-13500 system running Ubuntu 24 compared to baseline Ruby and ruby-prof 1.7.1, the profiler that comes closest in terms of overhead. Estimated per-function-call overhead is 23 ns for this profiler and 538 ns for ruby-prof.
Why Trace in Production
In a word: outliers. Sampling profilers show where a program spends its time on average. However, issues like high tail latency are, by definition, poorly represented in an average view. That’s where a tracing profiler comes in handy.
Let me illustrate this with a sophisticated SaaS simulator that handles a bunch of API calls and records the duration of each one:
durations = []

100_000.times do
  start_time = Time.now

  api_handler

  durations << Time.now - start_time
end
Let’s assume api_handler is a black-box function with a P99.9 latency SLO of < 10ms. Running the snippet yields:
P50 latency:     1.1 ms
P99.9 latency: 101.3 ms
Our median (P50) looks fine, but the P99.9 violates the SLO.
If you care about latency, you’re probably already running a sampling profiler, so let’s see what it shows:
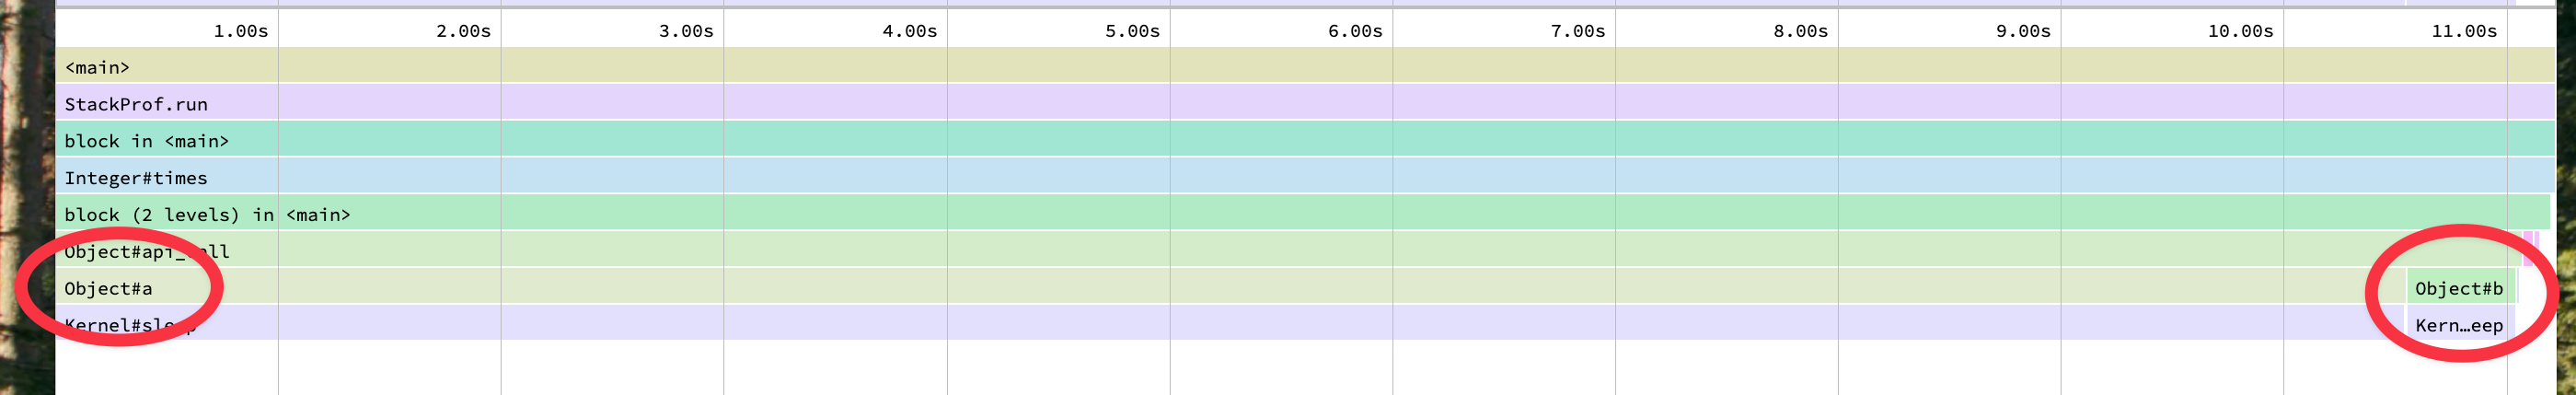
We see that two methods account for most of the runtime: api_handler->Object#a and api_handler->Object#b. Of those, a consumes the majority of the time slice. You might therefore conclude that optimizing a is the right move, but in this case, that would be a waste of effort!
To demonstrate this, let’s record a trace from one of the slow api_handler executions using our new profiler. First, we instrument the code:
+ require 'tracing'

 durations = []
 SLA = 0.01

 100_000.times do
   start_time = Time.now
+   Trace.reset

   api_handler

   duration = Time.now - start_time
+  if duration > SLA
+     Trace.save("api_call_trace.json")
+   end

   durations << duration
end
Now let’s look at one of the slow traces:

Here we see the exact opposite: b now consumes the majority of the time slice. So who’s right?
Let’s peek inside the api_handler black-box:
# api_handler always executes a, which sleeps for 1 ms
# 0.1% of the time it also executes b, which sleeps for 100 ms
def api_handler
  a
  if rand >= 0.999
    b
  end
end

def a
  sleep(0.001)
end

def b
  sleep(0.1)
end
The sampling profiler correctly shows that over the entire run, we spend more time in a, but when chasing tail-latency issues, that is not what matters. Here, a tracing profiler is the right tool for the job and b is the right function to optimize.
One small additional advantage of tracing is that it gives us a true time axis: events actually occur in the order shown, unlike in a sampled flame graph. This can be quite helpful when debugging.
Thread-State Changes
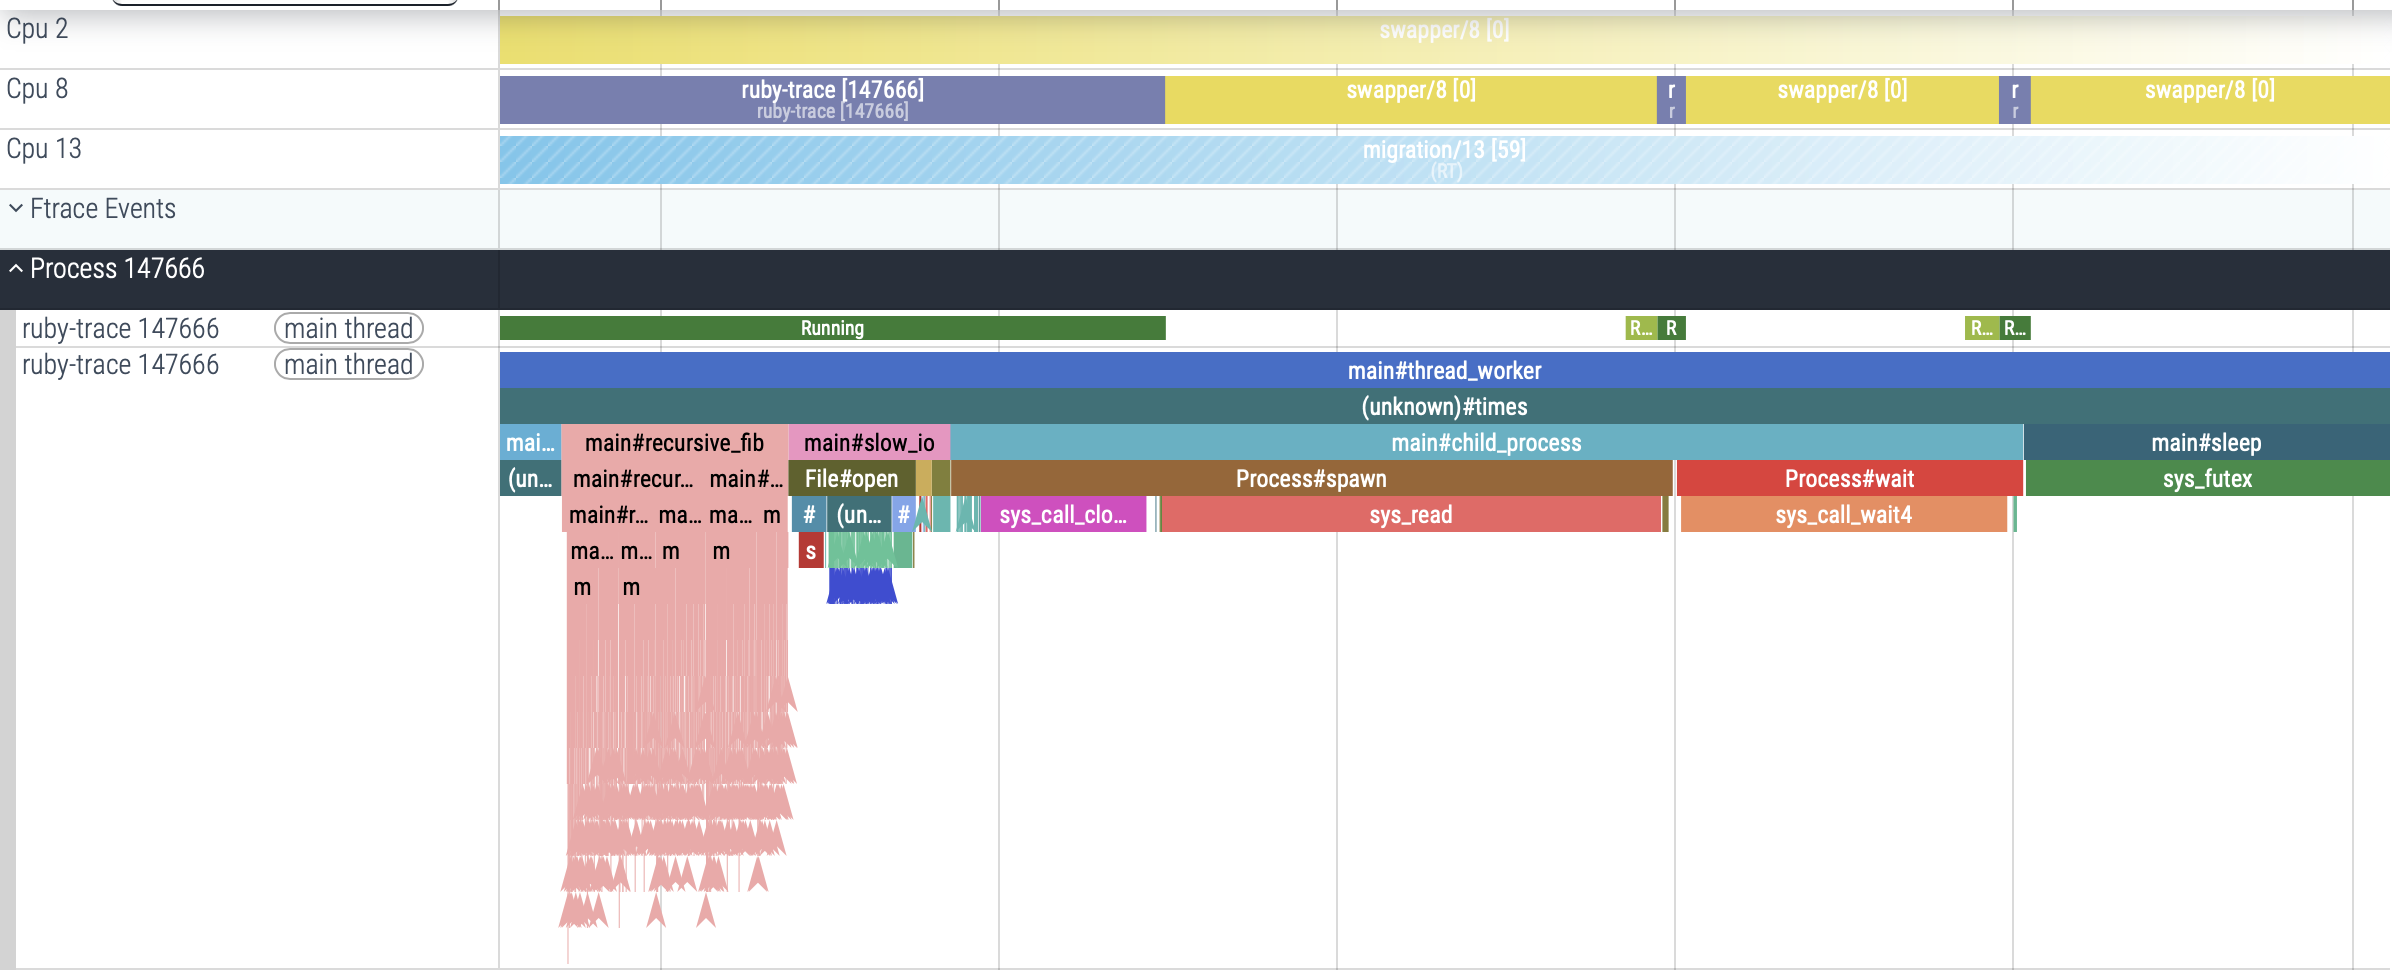
Another event stream I’ll mention here is thread-state changes and why tracking them helps. You might assume that whenever you see a stack trace in a trace view, like the one outlined by the red box below, the code is actively executing.
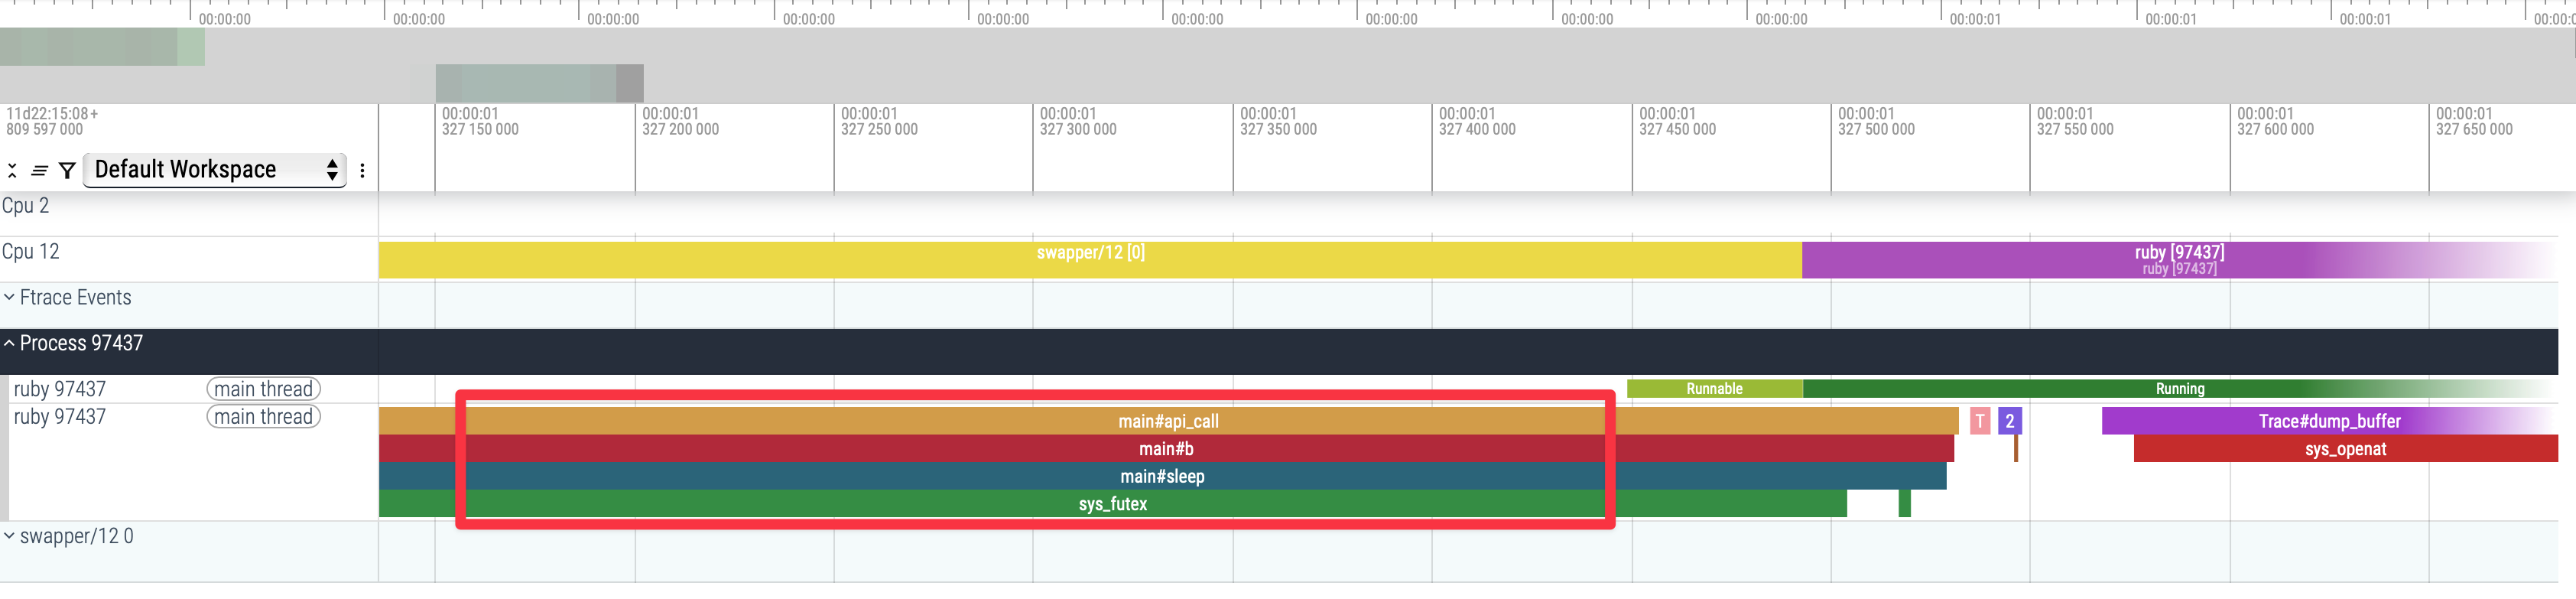
But that isn’t necessarily the case. Notice the light-green Runnable slice and the dark-green Running slice in the example above. That track shows that the Ruby thread was not running at first, later became runnable, and finally began executing. In this case the reason is fairly clear when you inspect the stack trace: the thread is in sleep, waiting on a futex, and in the yellow-and-purple CPU 12 track you can see the Swapper process running on the core instead.
But less obvious instances exist as well: if the CPU you’re running on is oversubscribed, the kernel scheduler may boop your thread off its core as it tries to give other threads time to run. If a code you own starts running slowly because someone else is stealing your cycles, you want to know!