Tracing System Calls in Python
Last time we counted CPU instructions, let’s look at syscalls now!
I’ll show you a little tiny tool I added to Cirron that lets you see exactly what syscalls a piece of Python code is calling and how to analyze the trace more effectively.
Let’s start with print("Hello") as before:
from cirron import Tracer

with Tracer() as t
    print("Hello")

print(t.trace)
# write(1, "Hello\n", 6) = 6 <0.000150s>
You can see1 print uses only a single
write to write the string
"Hello\n" to stdout (that’s what the 1 stands for) and asks it to write at
most 6 bytes. Write then returns 6, meaning it managed to write all the
bytes we asked it to. You can also see it took 0.00015s or 150μs (that’s just the
write call, not the whole print statement).
Pretty cool!
How does Tracer work? I initially wanted to use the
ptrace syscall to
implement it, but that turned out to be a little more complicated that what I
wanted, so in the end I just used the strace tool, which also uses ptrace
but handles all the complexity. Tracer simply starts tracing
itself with
it, redirecting output to a file, which is then parsed when it’s asked to stop.
Let’s trace import seaborn now:
from cirron import Tracer

with Tracer() as t:
    import seaborn

print(len(t.trace))
# 20462
Turns out importing Seaborn takes ~20k syscalls! That’s obviously too many to just print out, so what’s a better way to analyze what it’s doing?
Visualizing traces with Perfetto
Perfetto Trace Viewer let’s you visualize all kinds
of traces. It can’t ingest strace output directly, but I’ve included a
function that converts Tracer output to Trace Event
Format,
something Perfetto can load:
from cirron import to_tef

(...)

open("/tmp/trace", "w").write(to_tef(t.trace))
This gets you a file you can open with Perfetto. I’m not going to describe all it can do; I uploaded a trace of import seaborn here, go play with it!
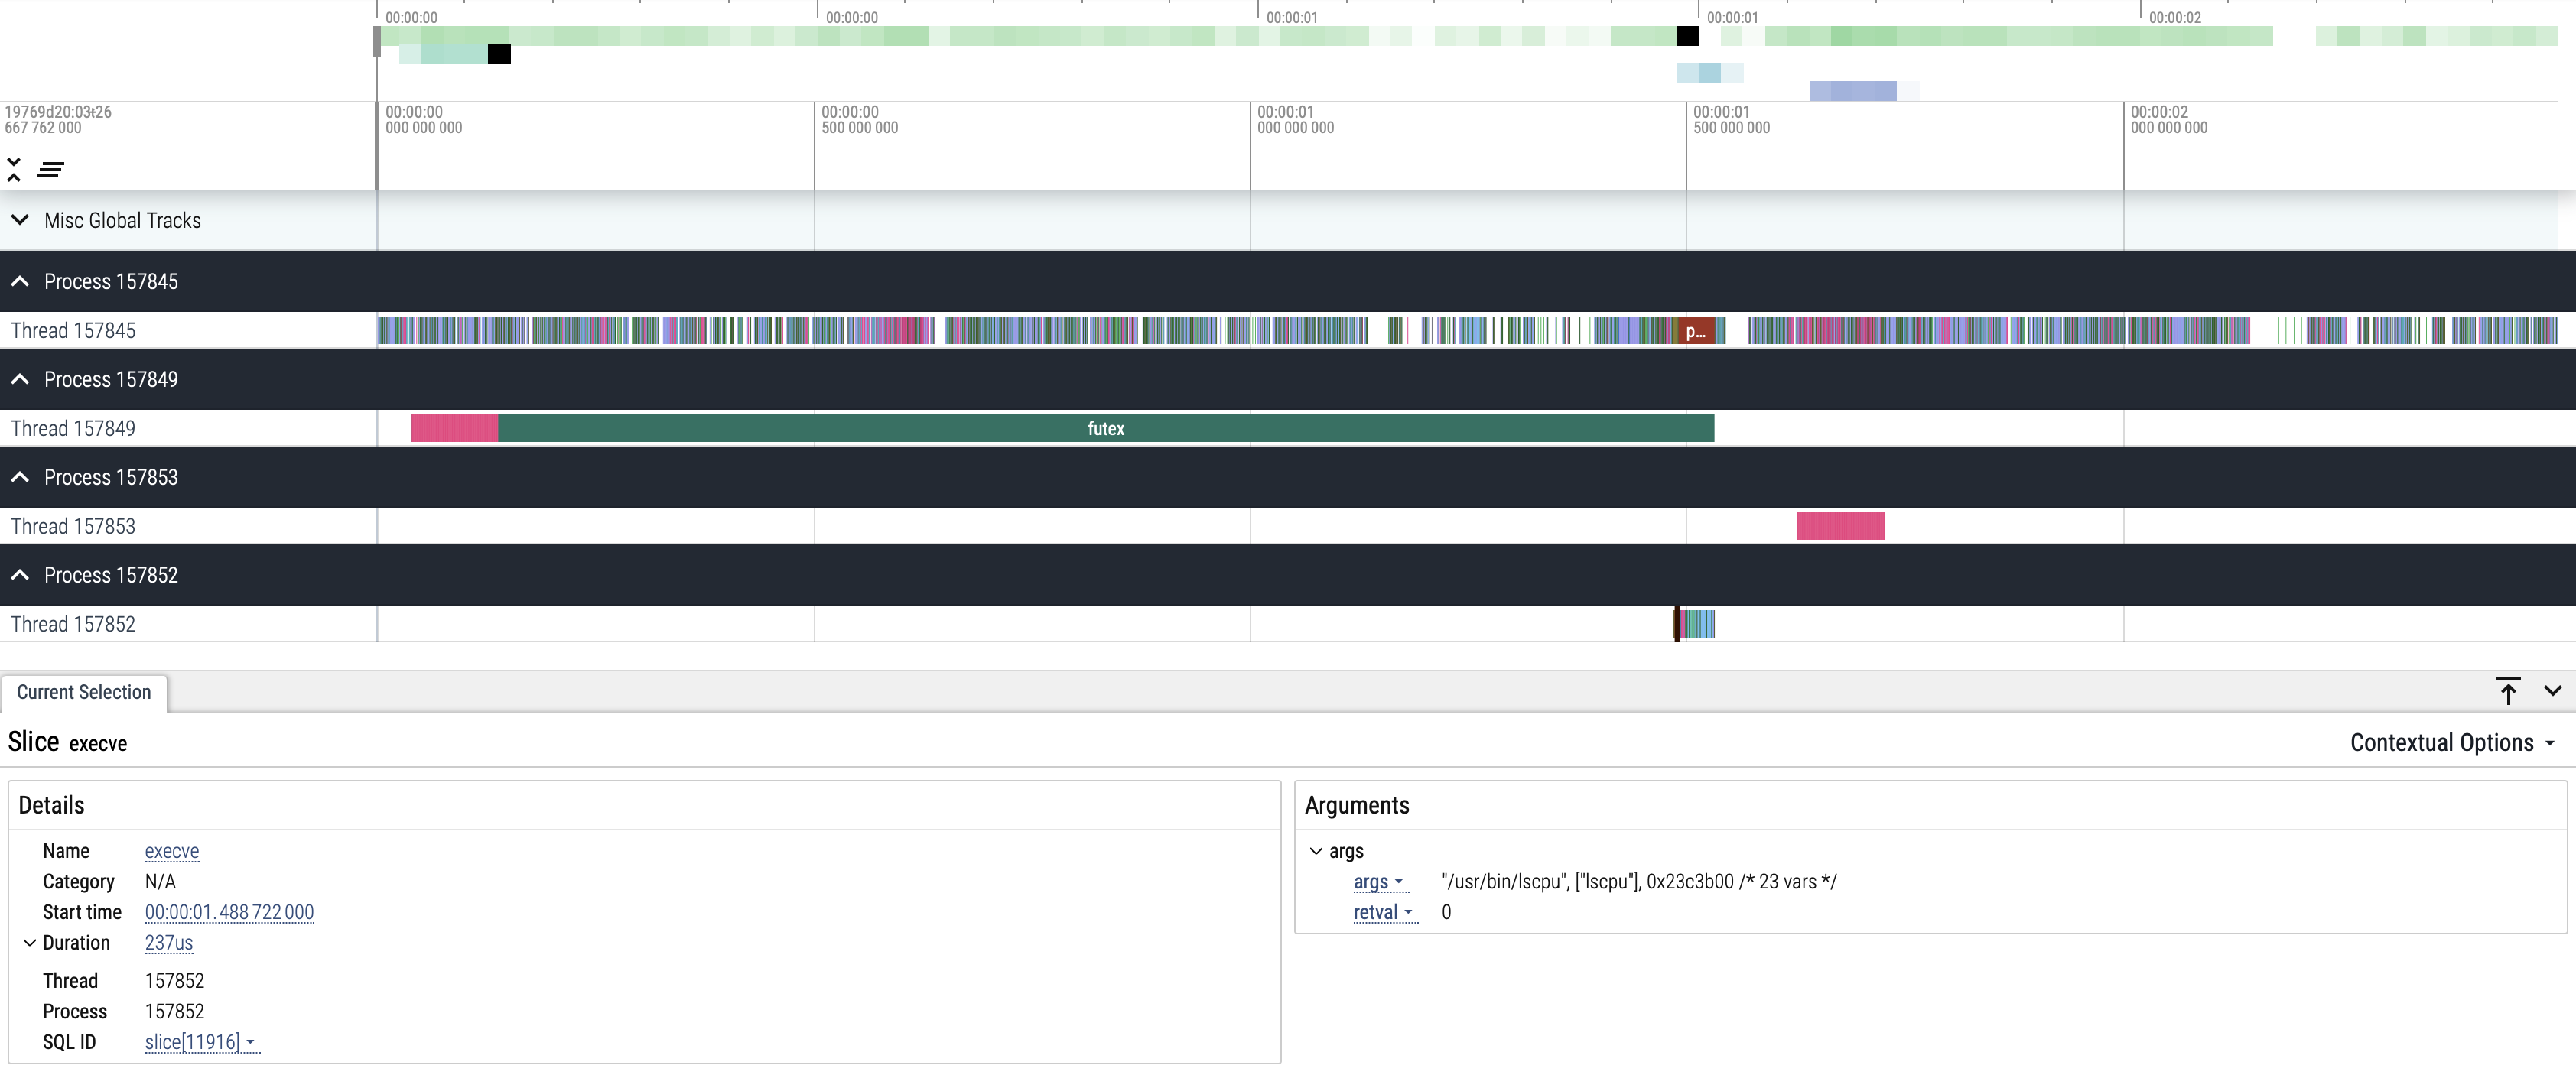
I was surprised to find it uses 4 threads, which mostly spend time looking up files and reading them, but one of the threads seems to be very curious about your CPU details!
Backlinks
Discussions on HackerNews and /r/Python.
-
If you try this yourself you’ll see a couple more calls, but those are related to shutting down
straceafter we’re done, not to the traced code itself. ↩