Counting CPU Instructions in Python
Did you know it takes about 17,000 CPU instructions1 to print("Hello") in Python? And that it takes ~2 billion of them to import seaborn?
Today I was playing with perf_event_open, a linux syscall that lets you set up all kinds of performance monitoring. One way to interact with the system is through the perf CLI tool. The problem?
root@X:~# cat print.py
print("Hello")

root@X:~# perf stat -e instructions:u python3 ./print.py
Hello

 Performance counter stats for 'python3 ./print.py':

          45713378      instructions:u

       0.030247842 seconds time elapsed

       0.025787000 seconds user
       0.004282000 seconds sys
45,713,378 is how many instructions it takes to initialize Python, print Hello and tear the whole thing down again. I want more precision! I want to only measure that single line of code.
Hence this little tool:
from cirron import Collector

with Collector() as c:
    print("Hello")

print(c.counters)
# Sample(instruction_count=17181, time_enabled_ns=92853)
Why would you want this? I was mostly just curious, but that’s not to say it
can’t be useful: let’s say you really, really care about performance of your
foo and you want to have a regression test that fails if it gets slower than
a threshold. So you time.time() it, assert less than a threshold and… you
realize your CI box is running a ton of concurrent tests and the timing is very
noisy.
Not (as much) the instruction count!
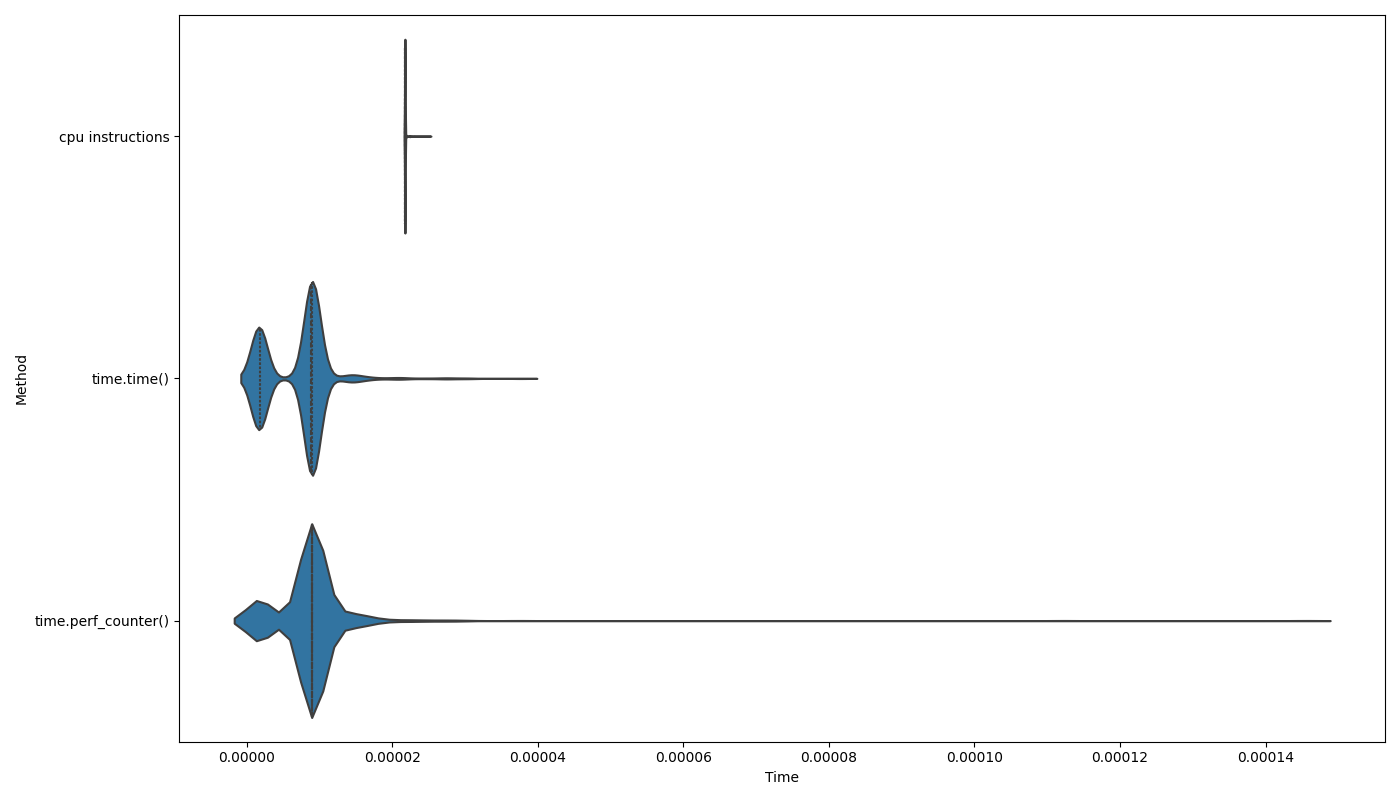
This graph shows distribution of time measurements of the same piece of code
using time.time() and time.perf_counter() and the instruction count
measured with Cirron, scaled to fit with the time measurement2. Note how
impeccably tight the instruction count distribution is (also note though
how it’s not completely
constant).
This is not to say instruction count is the be-all and end-all. Equal instruction counts can have wildly different wall clock timings, etc. Still, it’s a useful tool if you’re aware of its limitations.
Here’s the Github repo, it’s very janky and only runs on Linux at the moment, thought I’ll probably add Apple Arm support soon. On the off-chance that there isn’t a tool out there that does this way better already and you’d find it useful if this was on PyPI or exposed more perf events or worked with $LANGUAGE, etc., let me know.
Backlinks
Discussions on /r/python and /r/programming subreddits.
-
Since writting this I have upgraded Cirron to substract its own overhead; it now measures
printat ~9,000 instructions. ↩ -
I’m sure comparing the two this way is completely incorrect, this is just me invoking the Cunningham’s Law. ↩